Aug 16, 2026Residential ESS
June 2026 Lithium Battery Report: Output Surges, Energy Storage and Exports Drive Industrial Growth
June 2026: China battery output 206GWh +59% YoY. Storage H1 +83%, exports 36GWh. LFP 83% share. CATL 46%, BYD 17%. Prices to rise H2.
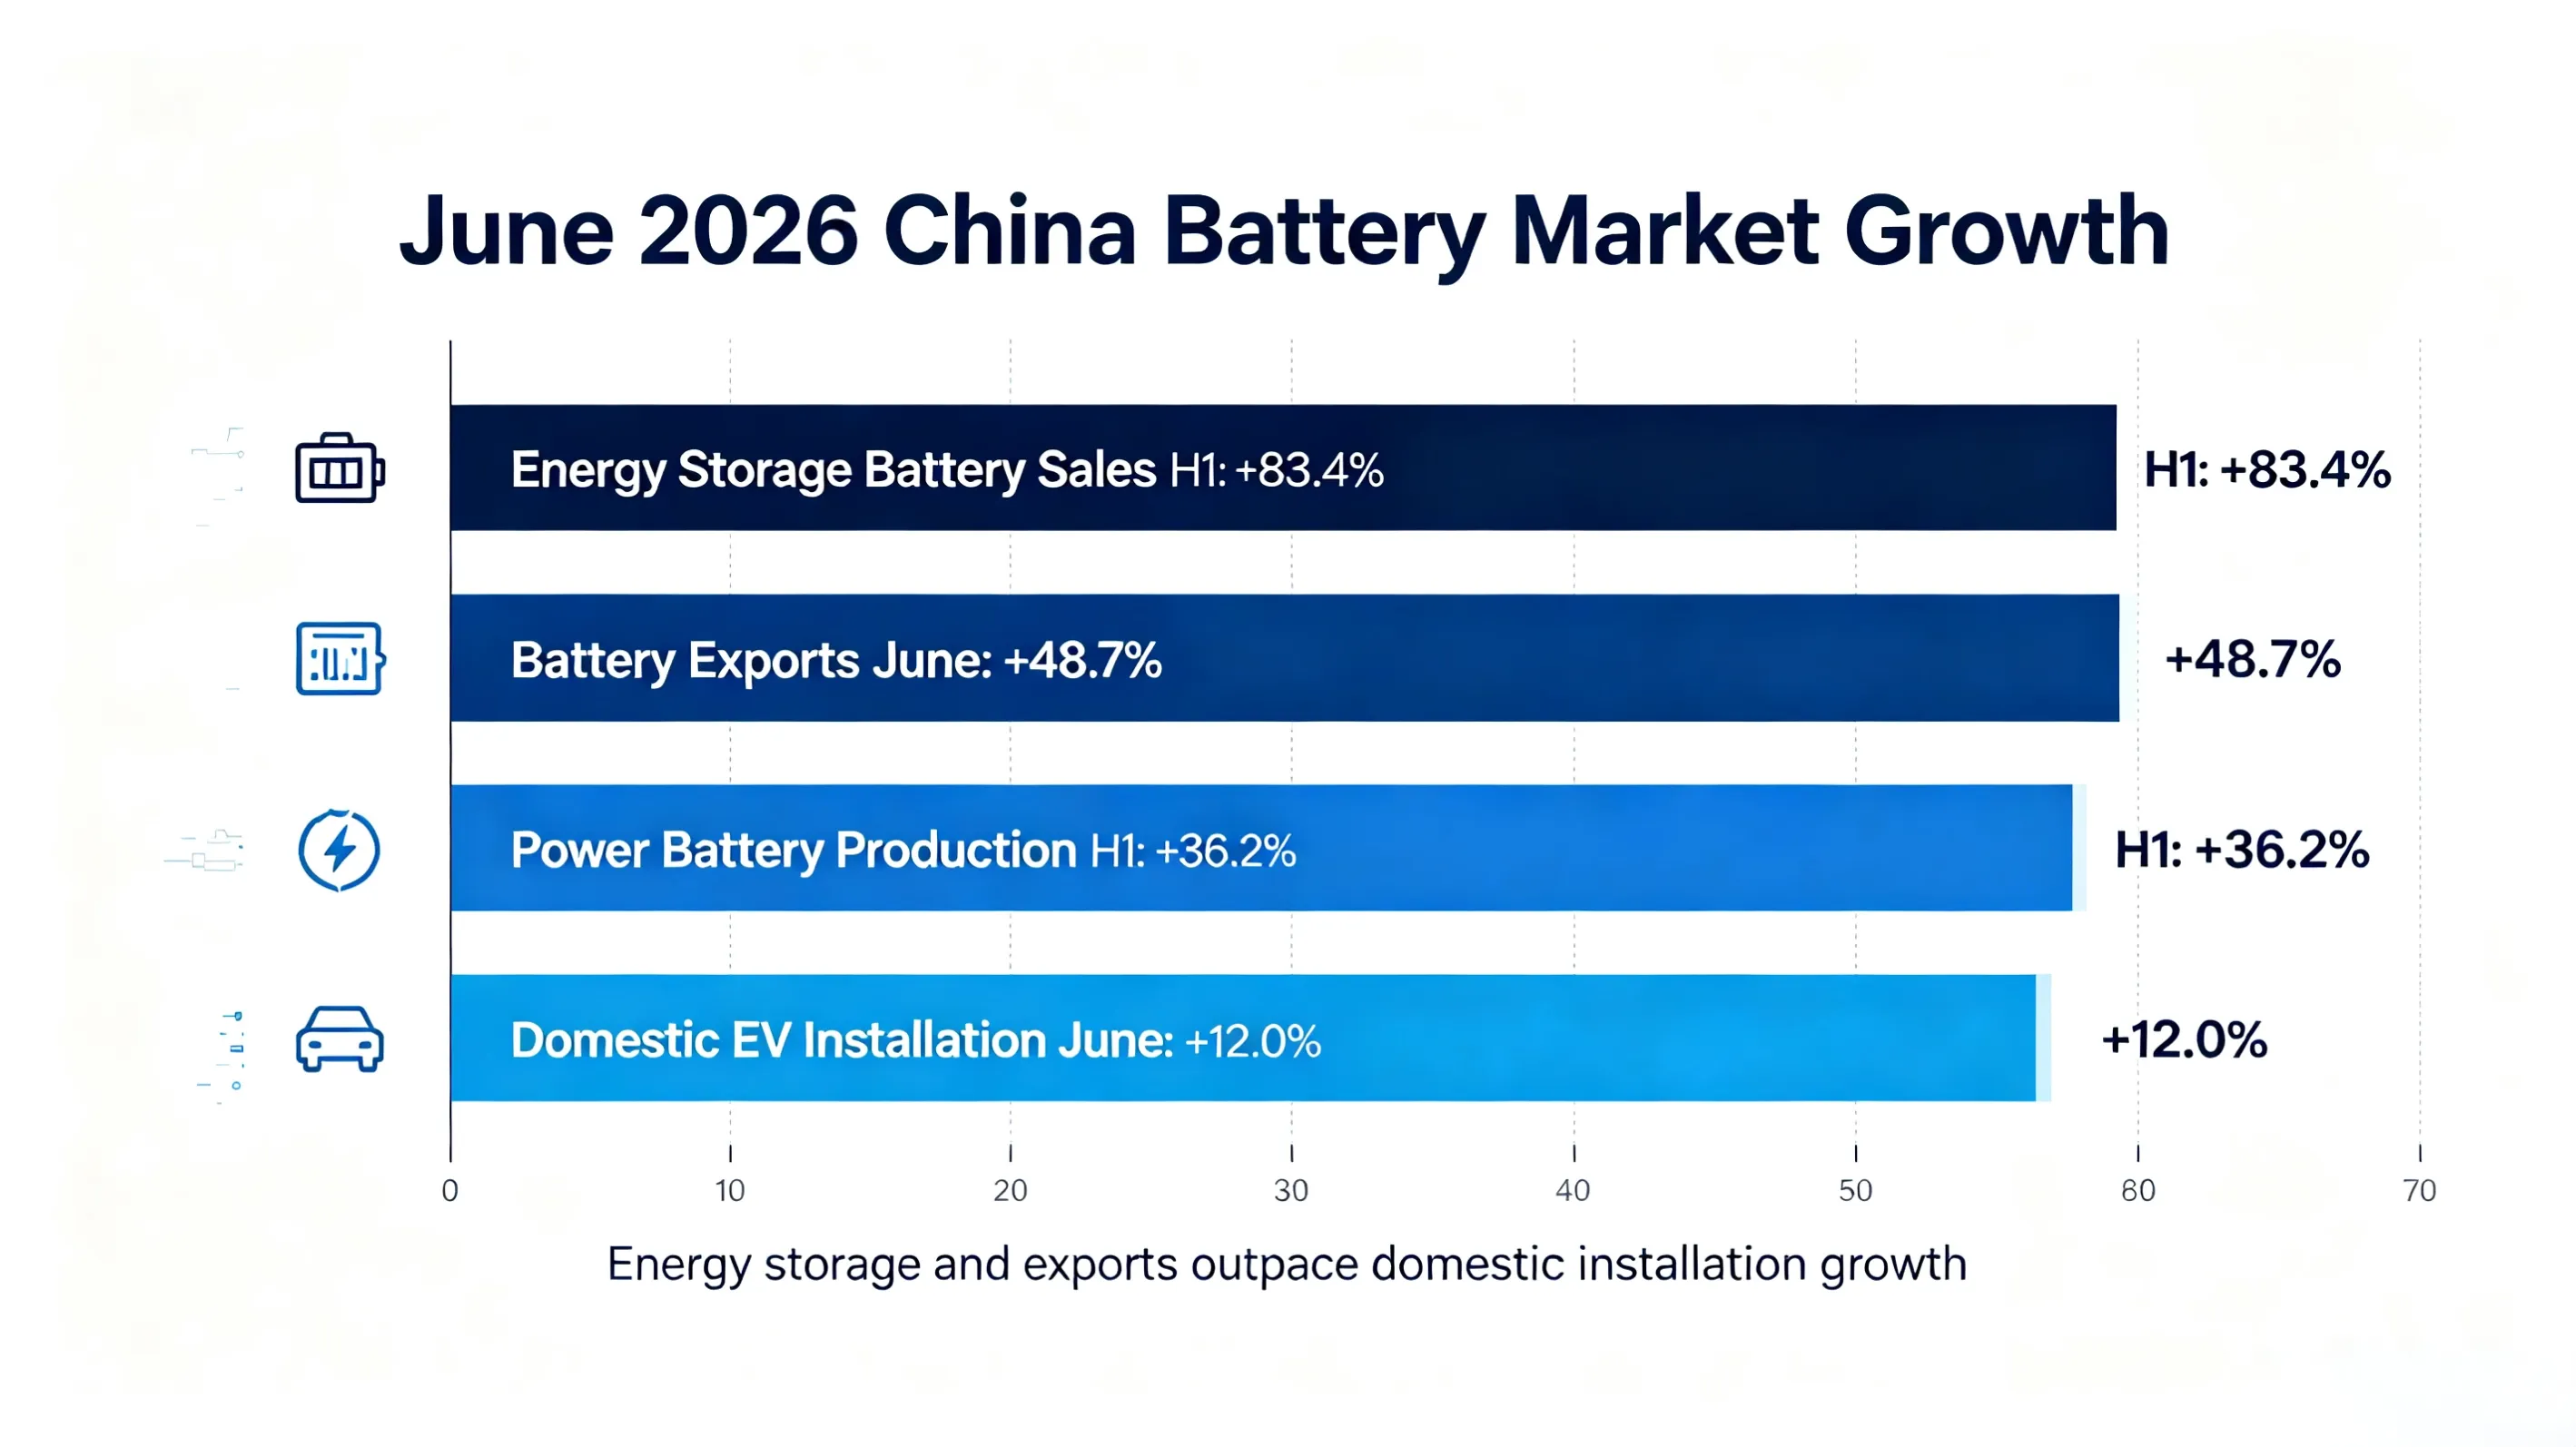
I. Core Industry Data
Metric | Value | Year-on-Year Change |
|---|---|---|
Total Battery Output | 206 GWh | +59.5% |
Domestic EV Installation | 76.5 GWh | +31.5% |
Domestic Installation Rate | 37% | -7 percentage points |
H1 Energy Storage Battery Sales | 485 GWh | +83.4% |
Monthly Battery Exports | 36.2 GWh | +48.7% |
Average Export Price | $17.4/unit | 5-month low |
LFP Battery Market Share | 83.3% | — |
II. Three Core Industry Facts
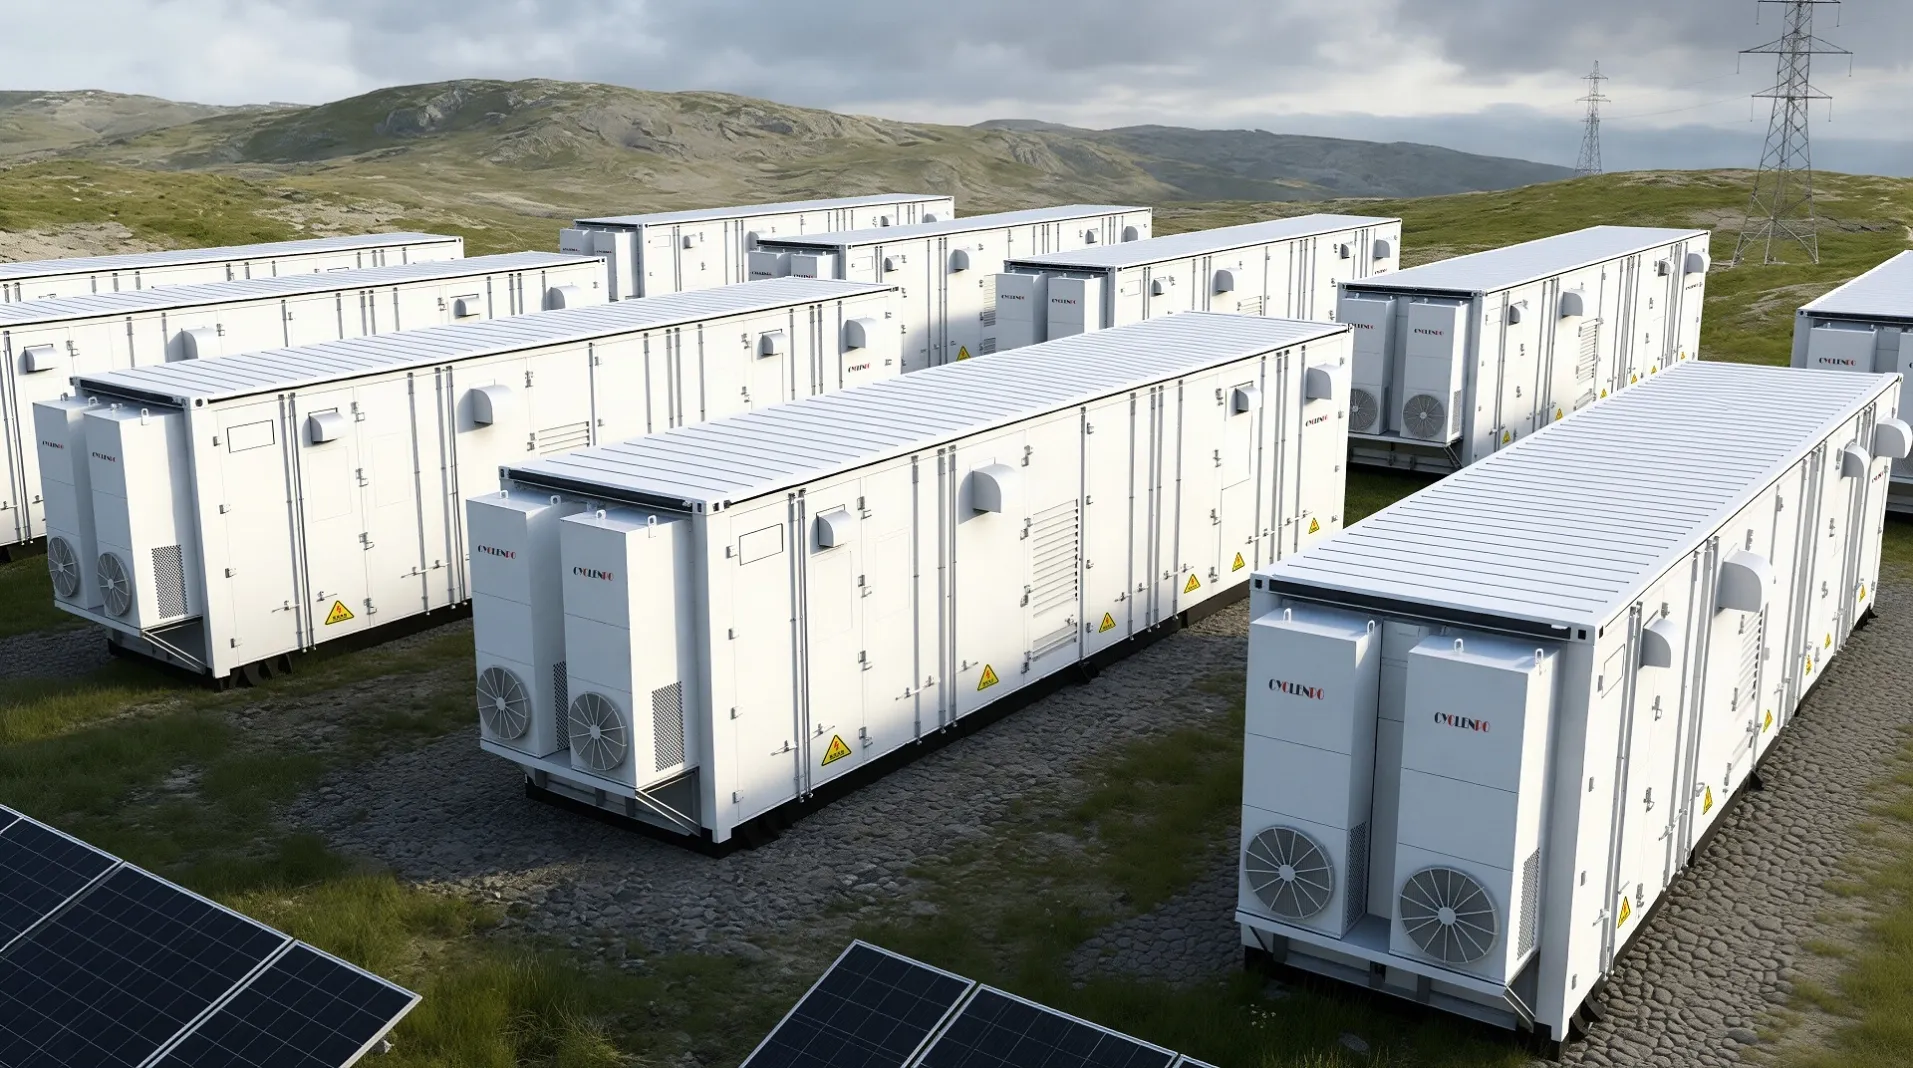
1. Divergent Demand Allocates Production Capacity: Over 63% of total battery output was supplied to the energy storage and overseas export markets in June, while only 37% was used for domestic EV installation, reflecting obvious structural differentiation in market demand.2. Energy Storage & Exports Become Core Growth Engines: The energy storage sector maintained explosive growth with H1 sales surging 83.4% year-on-year. Meanwhile, monthly battery exports hit a record high, becoming the two major growth pillars of the lithium battery industry.3. Stable Technology and Market Leader Pattern: Benefiting from cost and safety advantages, LFP batteries occupied 83.3% of domestic EV installation share with solid technological dominance. CATL ranks first in the industry with a 46% cumulative market share, maintaining its leading position.
III. Two Key Industrial Changes
1. Minor Share Adjustment Among Top Manufacturers: Driven by the iteration and upgrade of second-generation flash-charging batteries, BYD’s cumulative domestic market share dropped to 17% in H1 2026, a year-on-year decline of 6.4 percentage points during the product transition period.2. Export Market Sees Volume Growth with Price Decline: Spurred by booming European market demand, China’s battery export volume increased significantly. However, the average export price continued to fall to a five-month low, forming a typical growth-in-volume-but-fall-in-price trend.
IV. Market Outlook
Driven by optimized supply and demand structure, lithium battery prices are expected to rise in the second half of 2026, with the growth range largely dependent on the cost tolerance of domestic vehicle OEMs. In addition, the 2% consumption tax scheduled to be implemented in September will have a limited impact on the overall industry and will not reverse the industry’s upward growth trend.